One year ago, when last we checked in on the state of the industry, things were looking good in terms of business. The data, provided by Portal.io through the thousands of residential integrators that use their service for proposals and project management, showed business on a steady rise throughout the year, after a brief slowdown around April 2020. When that study ended in September 2020, growth was still shooting upward at an impressive rate.
Could this trend continue as the country moved toward post-pandemic life and many dealers with new products in the manufacturing pipeline were confronted by chip shortages and shipping delays? Seeking answers, we went back to the Portal.io team — founder and CEO Kirk Chisholm and president Josh Willits — to pick up where we left off.
Winning Proposals
Figure 1 shows the average accepted proposal volume per dealer per month from February 2020 through September 2021 — “accepted” being the operative word, as these were proposals that were won. The April 2020 dip is shown, but from there on it grows fairly steadily, with a slight plateauing during the 2020 holiday season, followed by a rise that continues for the rest of the year, with September again concluding on a high note. [Note that Portal.io grew its user base between these reports, but Willits accounted for that. “I removed the element of Portal’s growth over the last two years by averaging the proposal volume per dealer and graphing that over time,” he says. “You can see the trend continues upwards.”]
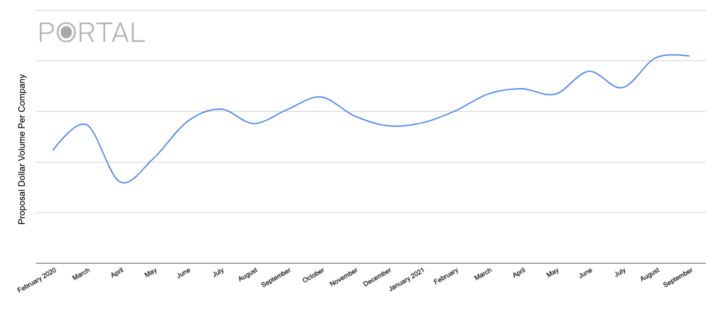
Comparing the information in Figure 1 to the number of proposals being generated overall, Chisholm saw that Portal dealers were winning more bids this year. “The number of proposals was pretty flat over that time period,” he explains, “so what that tells me is, since the number of proposals that our users were creating stayed flat, but the jobs they were winning was rising, that the closing percentage is going up.”
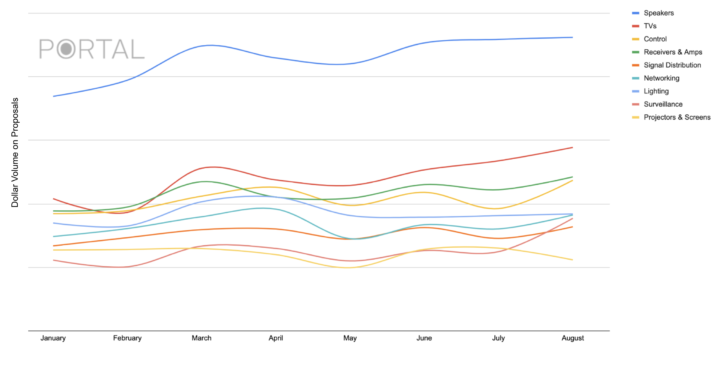
When we looked at the equipment being specified by dollar volume, shown in Figure 2, the chart looked similar to 2020’s — still growing, but not on as steep a curve as the previous year. The top categories were still speakers and televisions, but for 2021, speakers are way above TVs. One possible reason is, as Willits notes, “just about every consequential supplier has raised their prices — some of them twice. This rarely happens, and this past summer it happened every couple of weeks.”
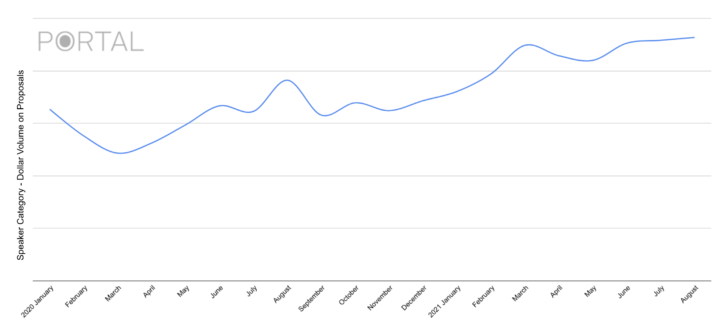
Figure 3 looks at the speaker category from January 2020 through August 2021. Starting in November 2020, it begins to climb, hitting an initial peak in March and then taking off again starting in June.
When we looked at the smaller categories by dollar volume, seen in Figure 4, and compared them to last year, we could see roughly the same trends; however, in 2021 the volumes for many of the brands fluctuated throughout the year, whereas in 2020 they kept mainly to the same pattern throughout the year, reflecting the diversity of jobs being done as the pandemic progressed and receded, as well as inventory shortages.
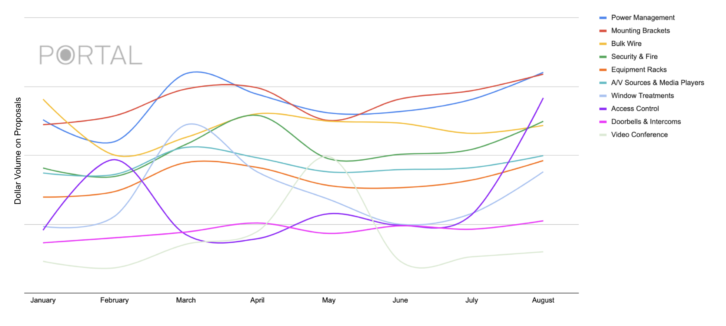
“Power Management and Window Treatments both had bumps in the spring before returning to normal, but still ended the summer with some growth,” adds Willits. “These categories are generally less affected by supply shortages and consumer expectations. Dealers are still benefiting from Security and Access control projects. Doorstations also escaped the fluctuations of other categories, showing steady growth in 2021.”
Supply Issues
Throughout the past year, Portal.io has been working with its vendors to analyze the supply situation — involving both companies that had stock and those that were struggling. Figure 5 shows two AV receiver brands with different supply situations over this past summer — the blue line, Brand 1, represents a well-known audio company that had stock issues, and the red line, Brand 2, represents a smaller audio company that had supply on hand. Brand 1 continued to be spec’d, but struggled to experience proposal growth, while Brand 2 had healthy growth throughout the summer.
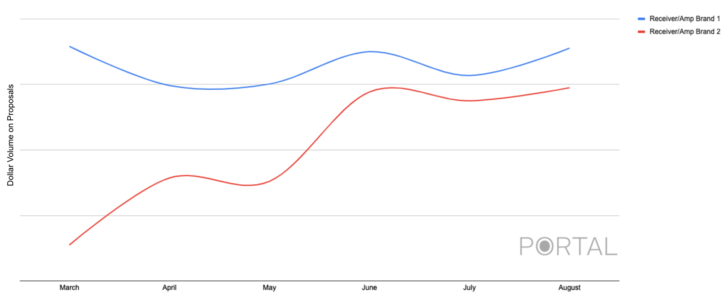
“The number of direct dealers specifying products didn’t fluctuate too much,” says Willits. “Distribution dealers had more severe brand fluctuations from what I assume, from that data, is because they’re working closely with their distributor and not necessarily committed to the brands. So they’ll flip to whatever’s available so they can do the job.”
Corroborating Views
We checked in with Jetbuilt, another proposal tool used by commercial and residential integrators, to see if its dealers were having experiences similar to Portal.io’s. According to JetBuilt founder and CEO Paul Dexter, they are, but they also revealed a few other integrator trends.
“Of the thousands of integrators using Jetbuilt, 25 percent serve both residential and commercial markets,” says Dexter. “Of this set, it was interesting to see certain movements: As corporate projects slowed, pivots were made toward large-scale residential work. Alternately, while budget-minded residential clients held tight, many in this set pivoted toward video conferencing.
“The data showed receivers, amps, and speakers outpacing most other categories in the last 12 months. We began to see a big uptick in activity starting in June, matching the comeback we see in other sectors. More projects per integrator, and far more spending by clients than the 12 months prior. Product categories such as shades and theater furniture, which held or declined in 2020, have ramped up since.
“But the big topic is the supply chain issue. We see projects sold with brand X processing systems being completely swapped for brand Y at time of purchase. This issue affects integrators to the degree that Jetbuilt has implemented a Lead Time indicator for items so that designers can make appropriate decisions during product selection.
“So things have been rocky to be sure, but all of this movement has driven integrators to be smarter and leaner. It has opened up more revenue categories for their futures. We feel that the industry will be better for it going forward.”
Distributor View
For the distributor perspective, we checked in with PowerHouse Alliance, which represents 850,000 square feet of warehouse space in 55 locations across the country, stocked with more than 250-plus product lines, including its own house-brand, A2V.
“The past year has been unlike any other in my history in the industry,” says PowerHouse Alliance executive director Dennis Holzer. “While PowerHouse Alliance members and customers saw a year of growth and strong business leads, this success has also come with challenges presented by supply chain issues, and these ripples have impacted nearly every corner of the custom installation industry.
“Let’s start with the positives — the PowerHouse Alliance’s fully stocked 55-plus locations were able to keep up with the continued demand and offer dealers access to the products they needed with convenient options for in-store, curbside pick-up, late night pick-up, and delivery options, as well. Our members saw the networking and display categories explode as consumers looked to upgrade their homes to meet the demands of working, learning, and entertaining their families from home. PowerHouse Alliance members saw so much growth this year that many of them have opened additional locations in their regions or have upgraded the square-footage of existing warehouses in order to accommodate stock increases and to support dealer needs.
“While PowerHouse members have been fortunate in our success over the last year, I do foresee some challenges ahead. We anticipated shipping delays to hit us this year but combined with the chip shortage, we can assume that these delays will continue through 2022. As delays persist, we are already seeing significant product and freight increases and the capacity to move freight has been hamstrung. From driver shortages to ships waiting weeks and even sometimes months to unload at ports, it not only impacts the ability to get items stocked, but we can expect that it will continue to impact the cost of product, as well.”
The current supply chain storm is no small inconvenience. Still, for all the upheaval and elements beyond their control, integrators, always resilient, have shown they will find a way to spec and win business.
For more detailed, brand-specific sales data, manufacturers and distributors can contact [email protected].